デザインツール

入力が無効です。特殊文字には対応していません。

Data center

A Stacked Solution: Micron SSDs and DDR5, Intel Xeon, & Supermicro break 25 STAC-M3™ world records

Ryan Meredith, Kevin Gildea (Intel guest) | October 2025

Intel®, Micron™ and Supermicro® are proud to announce that we’ve set new world records for 25, that’s right 25, STAC-M3™ benchmarks! STAC-M3 is the set of industry-standard financial enterprise tick analytics benchmarks for database software and hardware stacks that manage large time series market data (“tick data”). Testing is organized into a baseline test (named Antuco) and a larger scaling test (named Kanaga).

The record-breaking solution based on Intel 6767P Xeon 6 processors, Micron 9550 NVMe™ SSDs, Micron 128GB DDR5 RDIMMs, and Supermicro SSG-222B-NE3X24R Petascale servers outperformed all publicly disclosed reports and set 25 new performance records on:

  • 19 of 24 Kanaga mean-response time benchmarks, including all 10 of 10 Kanaga 50-user and 100-user benchmarks
  • 3 of 5 Kanaga throughput benchmarks
  • 3 of 3 Antuco 50-user and 100-user benchmarks

For this blog, we’ll focus on the highest scaled tests in Kanaga and Antuco to demonstrate amazing performance with far less hardware than the previous record holders.

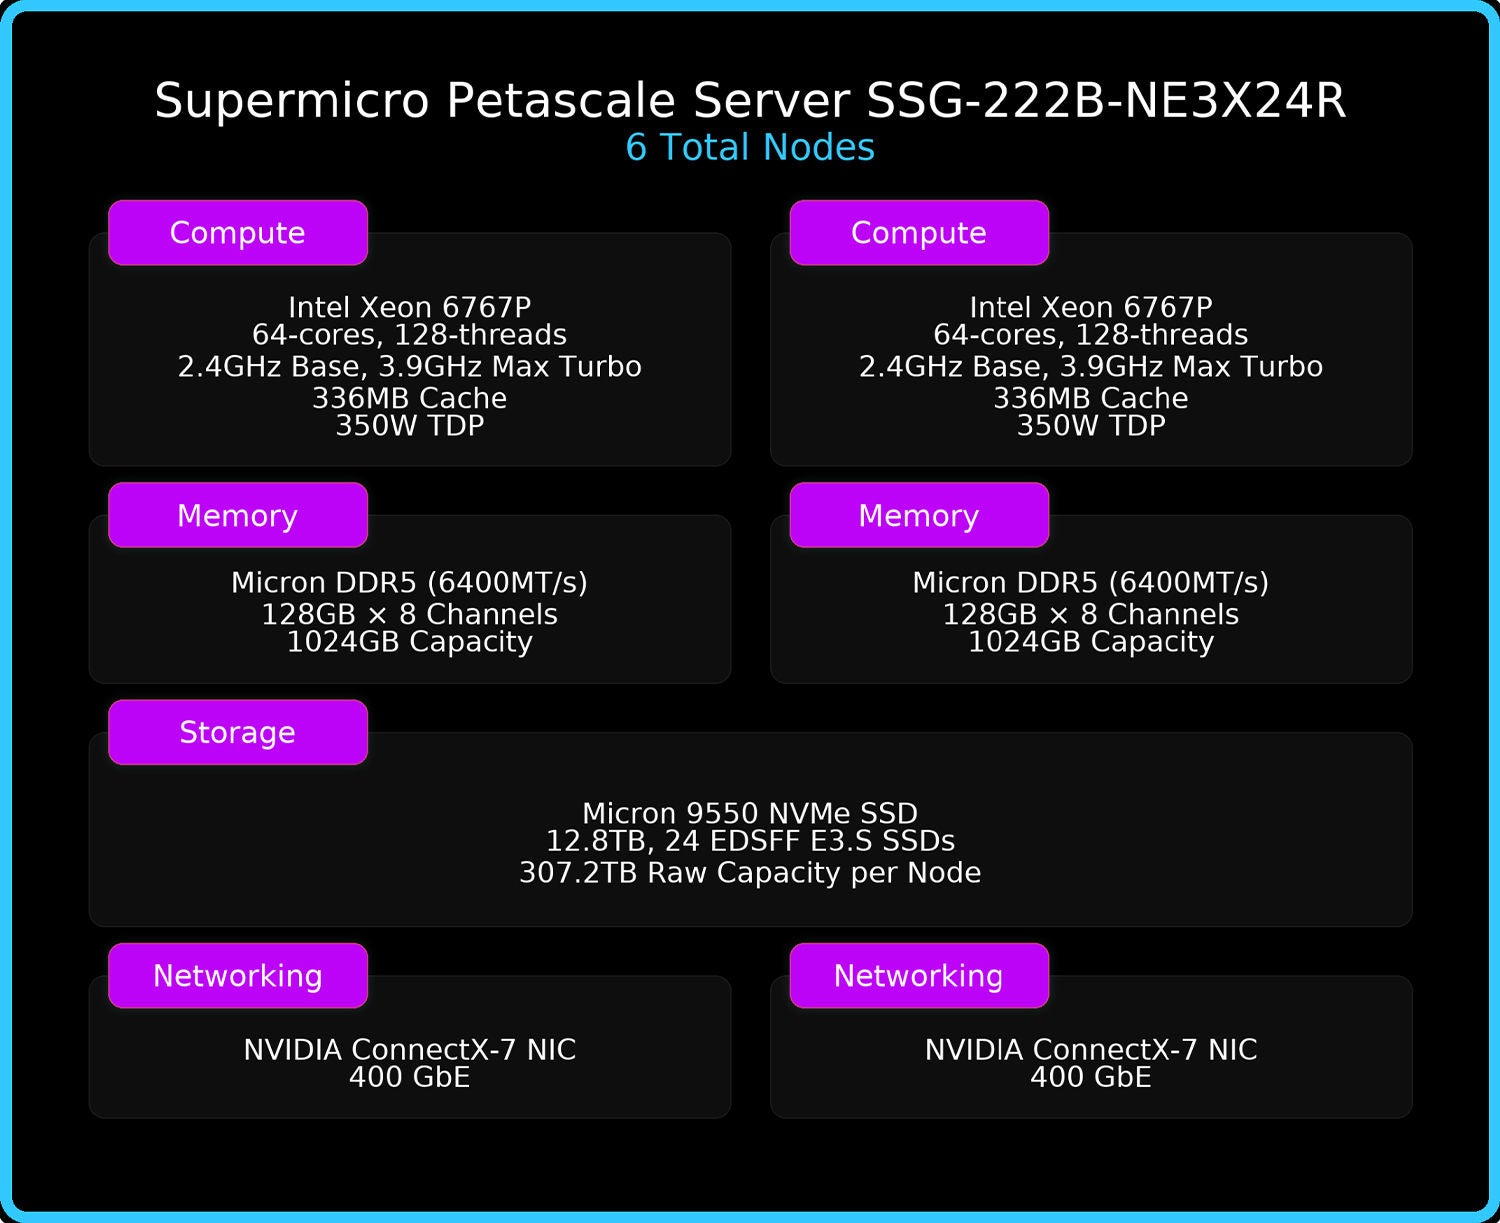
The 6 Supermicro SSG-222B-NE3X24R Petascale server nodes Figure 1: The 6 Supermicro SSG-222B-NE3X24R Petascale server nodes

(click image to enlarge)

System architecture

Before diving into the results, let’s look at the system under test:

We used 6 Supermicro SSG-222B-NE3X24R Petascale servers clustered over 400GbE. Each server has:

  • 2x Intel Xeon 6767P processors, 64-cores each, 128 cores of compute per node, 768 cores total
  • 16x 128GB Micron DDR5 DRAM, 2TB of memory per node, 12TB total
  • 24x 12.8TB Micron 9550 NVMe SSDs, 307.2TB of storage per node, 1,843TB total
  • 2x 400GbE ConnectX-7 SmartNICs, 100GB/s network throughput per node, 600GB/s total

The solution runs on kdb+ 4.1 from KX Software with the STAC-M3 Pack for kdb+.

The STAC-M3 benchmark suite

Analyzing time-series data—like tick-by-tick and trade histories—is essential for functions ranging from algorithm development to risk management. But with automated trading, especially high-frequency strategies, now dominating the markets, such analysis has become both more critical and more complex. As trading robots try to outwit each other at the microsecond or sub-microsecond scale, they dish out quotes and trades in ever more impressive volumes. This places a premium on technology that can efficiently and rapidly store and analyze that activity.

The STAC Benchmark Council has developed the STAC-M3 benchmarks to provide a common basis for quantifying the extent to which emerging software, cloud and hardware innovations improve the performance of the storage, retrieval and analysis of market data time series (“tick”) data.

STAC-M3 is divided into two suites of benchmarks based on workload size:

  • Antuco: A smaller-scale benchmark designed to measure a single node’s performance
  • Kanaga: The scaled-up version of Antuco that will stress a large hardware deployment

While our STAC-M3 report includes detailed results for both benchmark suites and all tests, we’re going to focus on the Kanaga results at the maximum dataset size in this blog.

STAC-M3 scales the dataset size by starting with a small dataset and then scaling it up by year, using a multiplier of 1.6 times the dataset size each year for 5 years. The “Year 5” dataset represents the largest dataset size under test and is the most difficult for a solution to process. The STAC-M3 benchmarks use latency in milliseconds as the unit of measurement of test results; therefore, a lower result is better.

Solutions comparison

STAC-M3 is tested on many hardware configurations; selection of components is up to the architects designing the system under test. For our solution, we focused on three main drivers:

  • Density: Can we outperform solutions requiring a much larger hardware footprint?
  • TCO: Is our solution cost-effective and sized appropriately?
  • Scalability: Can our solution scale past the tested configuration?
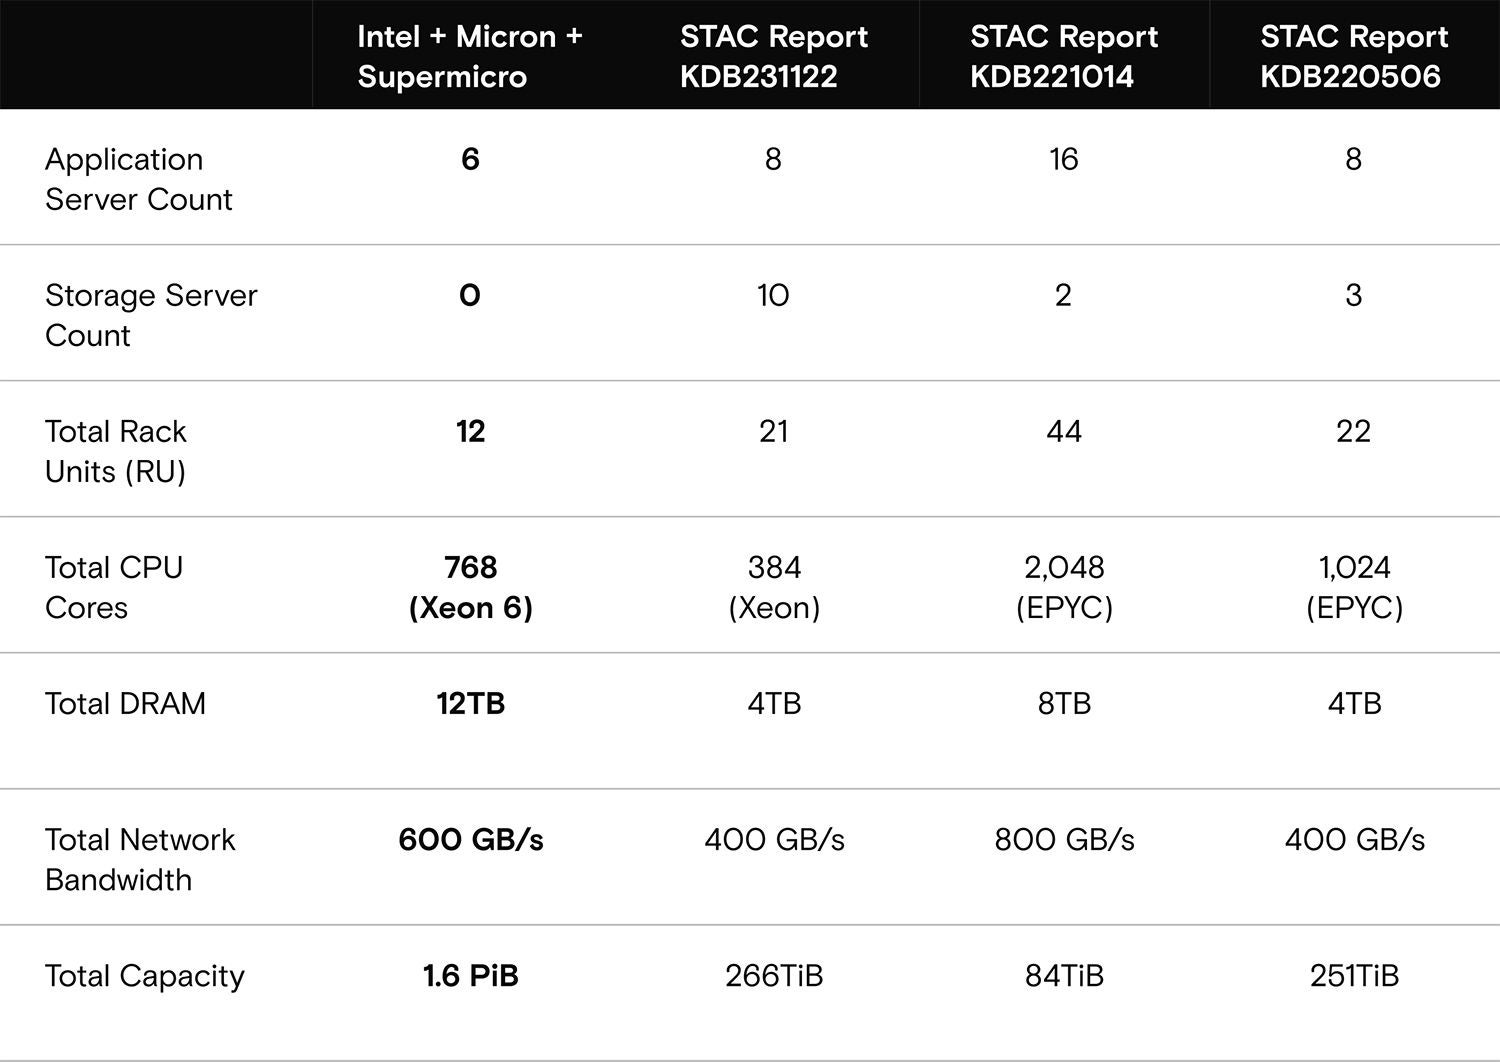
Table 1: Performance comparison of STAC-M3 vs. previous recordholders Table 1: Performance comparison of STAC-M3 vs. previous recordholders

(click image to enlarge)

We compared our solution with the last three published STAC-M3 reports:

  • We have the smallest footprint by RU: 12RU vs. 21RU to 44RU
  • We use the 2nd fewest CPU cores: 768 cores vs. 384 to 2,048 cores
  • We have the highest storage capacity: 1.6PiB (equivalent to 1.8TB) vs. 84TiB to 266TiB
  • We have the highest memory capacity: 12TB vs. 4TB to 8TB

As you will see, our solution dramatically outperformed the previous recordholders with a much smaller solution footprint.

Results: high bid over varying intervals

5YRHIBID uses a single thread to return the highest bid price for each of a certain 1% of symbols over a particular range of years in the dataset. The range for 5YRHIBID is from the first day of 2011 through the last day of 2015. It is a heavy read intensive workload with light algorithm compute intensity.

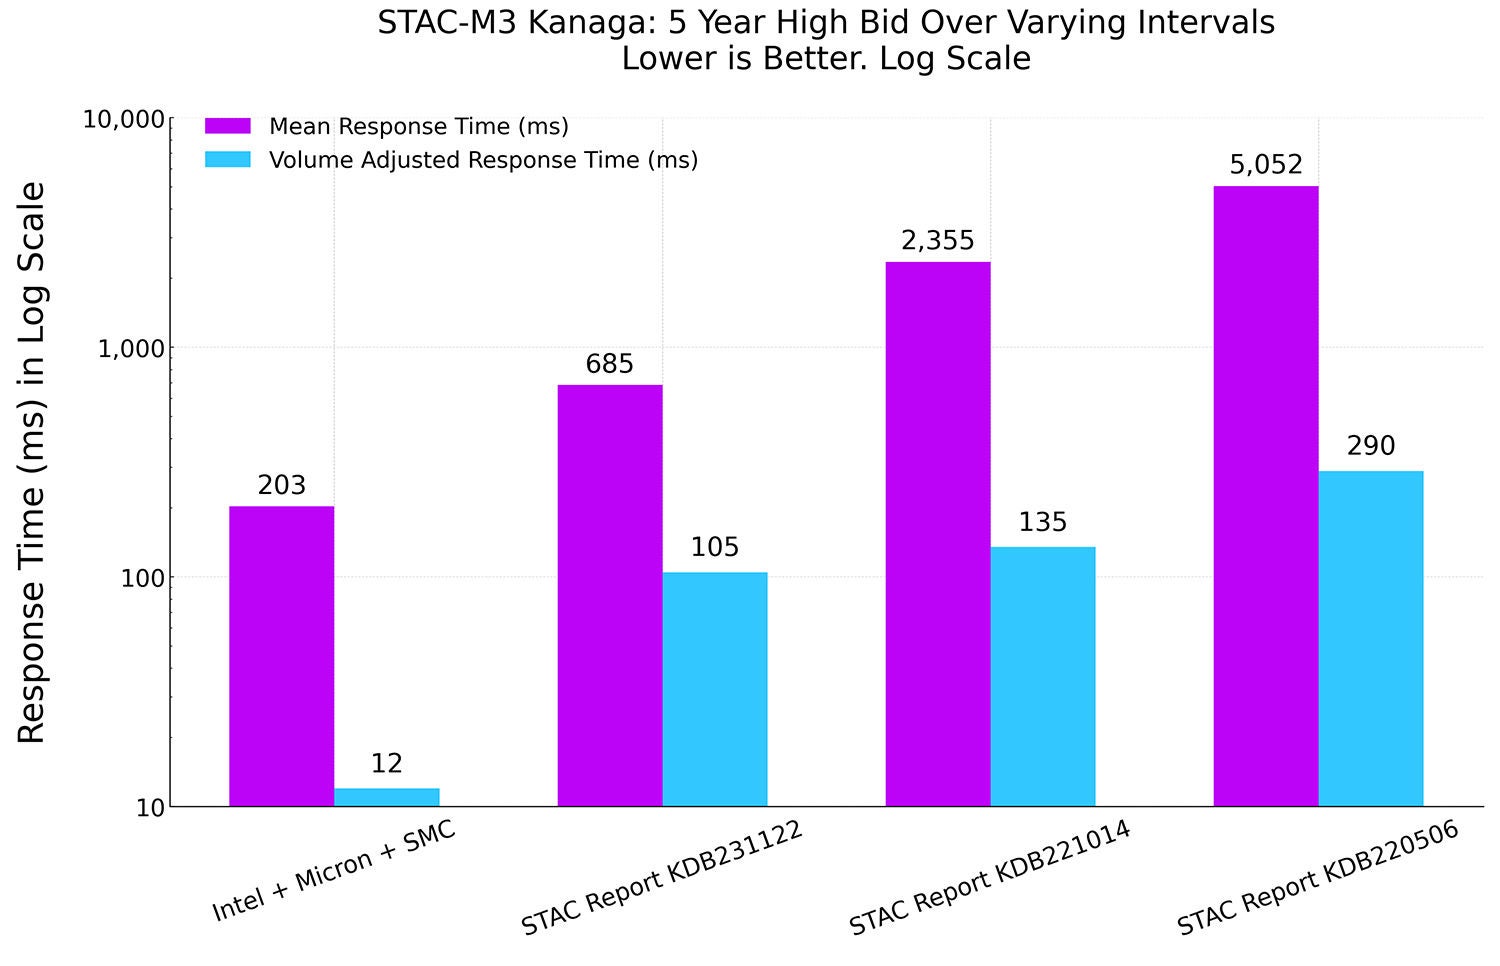
Graph 1: STAC-M3 Kanaga, Year 5 mean and volume adjusted response times vs previous recordholders Graph 1: STAC-M3 Kanaga, Year 5 mean and volume adjusted response times vs previous recordholders

(click image to enlarge)

Drastic improvement in response time

Our STAC-M3 solution saw a 70% reduction in mean response time and an 89% reduction in volume-adjusted response time from the next best score. Volume-adjusted response times normalize response times to see how the response time per quote or trade changes with the size of the dataset. Note that the above graph is in log scale.

One reason for the drastic reduction in response time is the dramatic increase in storage throughput enabled by the Micron 9550 NVMe SSD.

Density: massive increase in storage performance

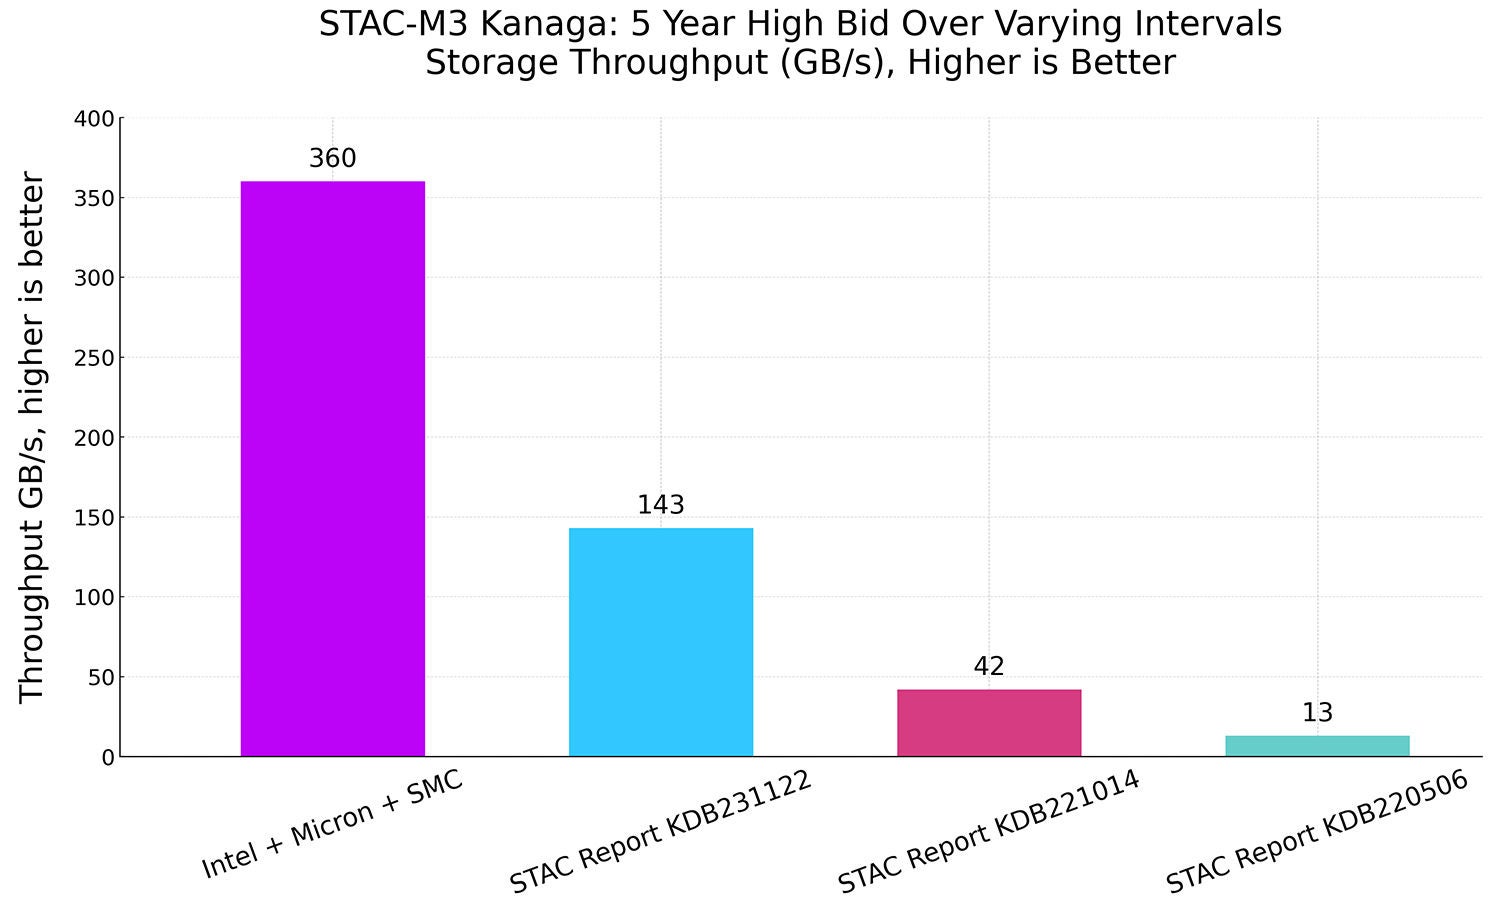
Graph 2: STAC-M3 Kanaga, 5 Year High Bid over varying intervals' storage throughput in GB/s vs. previous recordholders Graph 2: STAC-M3 Kanaga, 5 Year High Bid over varying intervals' storage throughput in GB/s vs. previous recordholders

(click image to enlarge)

Our solution has over 2.5x the storage performance of the next closest test in a much smaller footprint.

Results: Unpredictable interval statistics

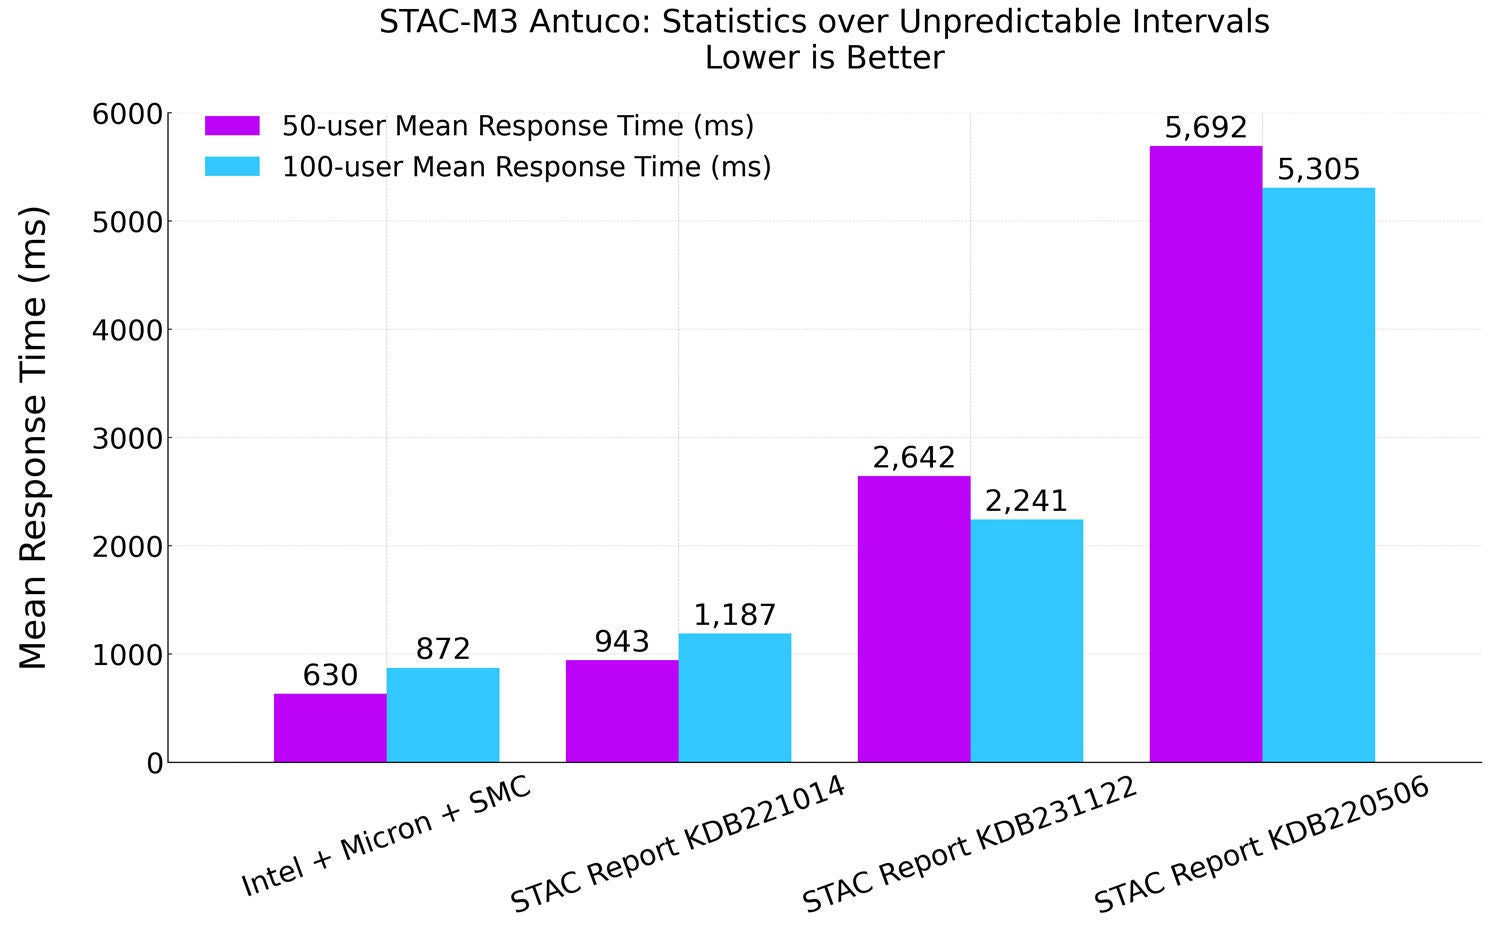
STATS-UI: Each user queries a unique combination of exchange, date and start time, then returns basic statistics for all high-volume symbols on one exchange for every minute in a 100-minute range. Start times are randomly offset from minute boundaries, and all ranges cross a date boundary. This workload is both heavily read-intensive and heavily algorithm-compute-intensive. Tests are designed to measure performance under increasing load, specifically at 50-user and 100-user levels, representing high-concurrency scenarios.

Speed: fastest results ever on compute- and read-intensive queries at high-concurrency

Graph 3: STAC-M3 Antuco, 50 & 100-user mean response times vs. previous recordholders Graph 3: STAC-M3 Antuco, 50 & 100-user mean response times vs. previous recordholders

(click image to enlarge)

Compared to the previous record holder KDB221014, our solution finished the compute-intensive 100-user benchmark 36% faster than ever before, all while using 62% fewer CPU cores. Our solution for the 100-user benchmark achieves a mean response time that is less than the previous record holder’s response time for the 50-user benchmark.

Results: 5-year market snapshot

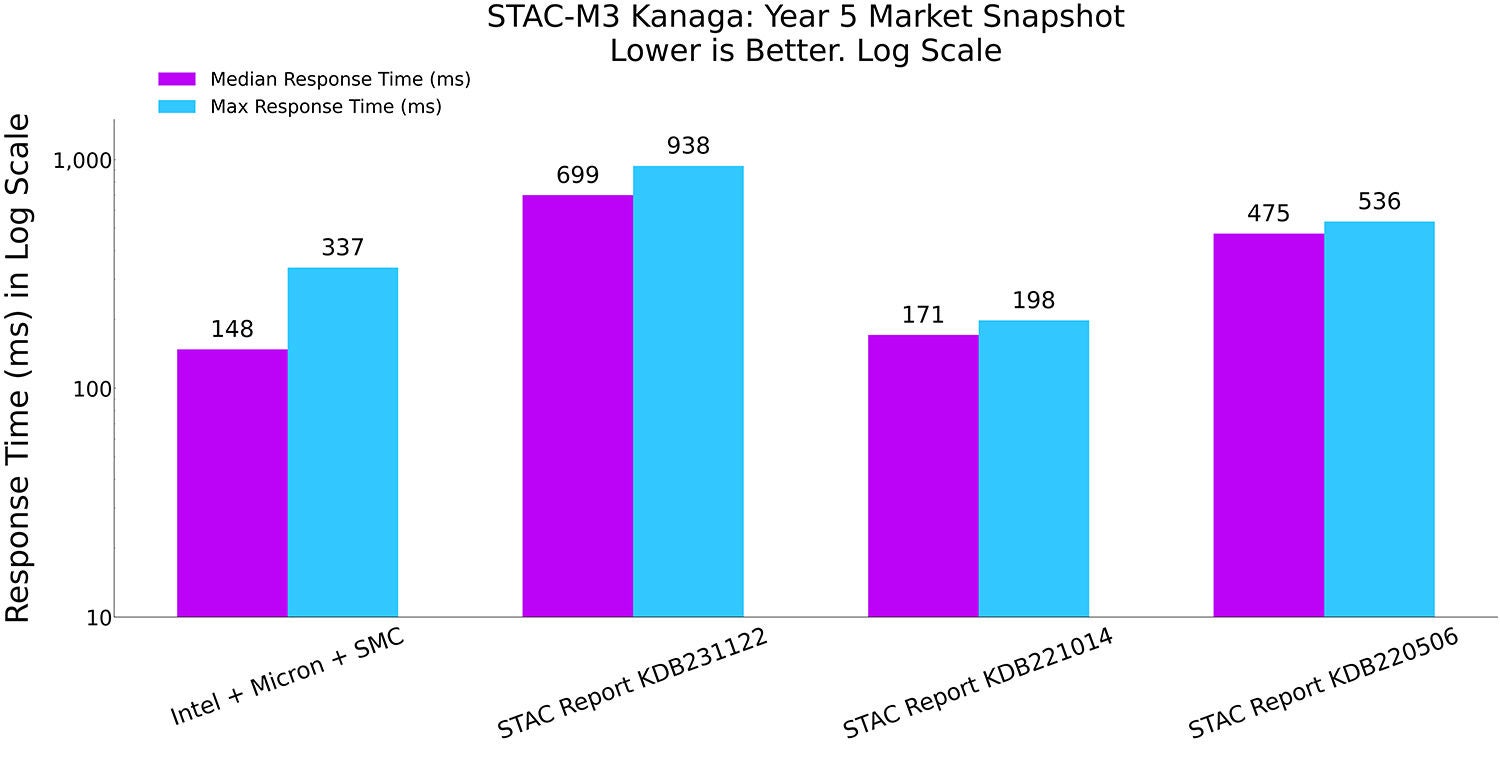
YR5-MKTSNAP: Returns the price and size for the latest quote and trade for each of a certain 1% of symbols at a unique time on a unique date in the given year of the dataset. YR5-MKTSNAP queries dates and times in 2015, on the largest dataset. This workload is heavily read-intensive and heavily algorithm-compute-intensive.

Graph 4: STAC-M3 Kanaga, Year 5 snapshot of median and max response times vs previous recordholders Graph 4: STAC-M3 Kanaga, Year 5 snapshot of median and max response times vs previous recordholders

(click image to enlarge)

TCO: achieving top-tier performance with fewer cores and significantly less rack space

Our solution scored the lowest median response time. While the KD2201014 report does have the lowest max response time, that test deployed 44RU with 2,048 CPU cores vs. 12RU with 768 CPU cores in our solution. Comparatively, we deliver faster median response times with 62% fewer CPU cores and 73% less rack space needed.

Results: year 5 volume weighted bid

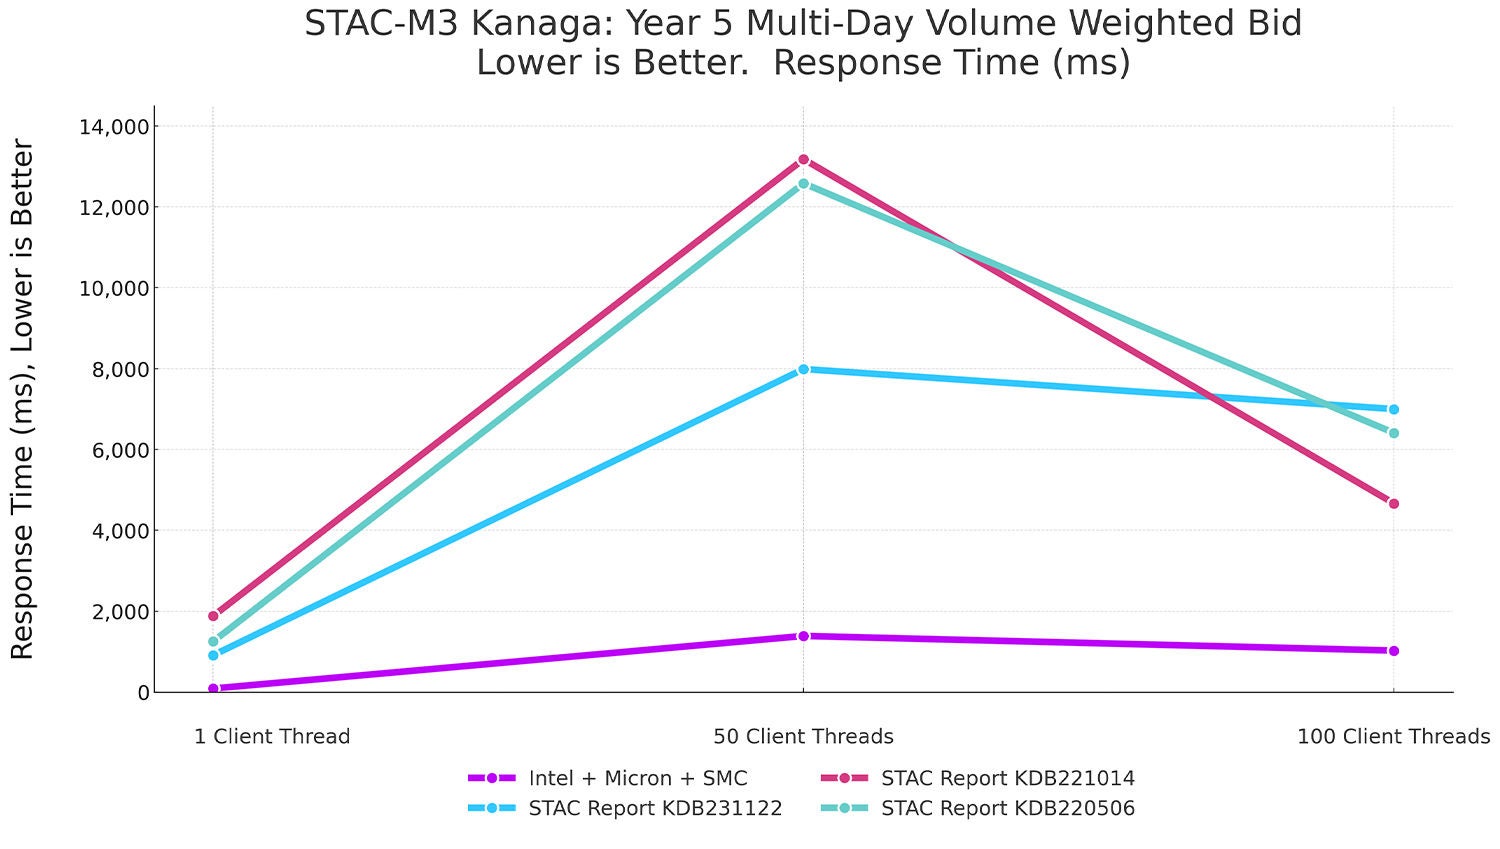
YR5 VWAB-12D-HO: Represents a 4-hour volume-weighted average bid for 12 randomly selected days, varying the number of concurrent requests. It operates in multiple years of the Kanaga dataset with dates and symbols chosen to ensure heavy overlap among requests, since this is a common pattern in the real world. It is a heavily read-intensive test with light algorithm compute intensity.

Graph 5: STAC-M3 Kanaga, Year 5 multi-day volume weighted bid vs. previous recordholders Graph 5: STAC-M3 Kanaga, Year 5 multi-day volume weighted bid vs. previous recordholders

(click image to enlarge)

This test is crucial; it shows the solution’s ability to respond to increasing user load.

Scalability: 10x higher user scaling performance

The results for YR5 VWAB-12D-HO are staggering. At 1 client thread, our solution is an order of magnitude faster than all published reports. It maintains a significant lead in 50 client threads (up to 9.5x) and at 100 client threads (up to 7x).

New frontier unlocked

Benchmarks show where the real frontier is. Records push that frontier forward and redefine what’s possible, sparking the collective imagination. When leaps in technology drive dramatic increases in speed, new use cases emerge and strategies once out of reach become reality. The faster you can look back, the farther ahead you can see.

That’s what happens when compute, memory, and storage are engineered to work in harmony—the frontier moves forward. STAC-M3 is an intensive suite that validates a solution’s readiness for demanding financial services workloads. Intel, Micron, and Supermicro combined resources to deliver a dense, scalable, modern stack that didn’t just surpass records set by larger configurations—it crushed them with dramatic performance gains.

Would you like to know more?

If you find yourself at the STAC conference in NYC on October 28, say hello to the architects of this work:

  • Kevin Gildea, Solutions Architect, Intel
  • Jay Walstrum, Principal Data Center Solutions Architect, Micron
  • Wendell Wenjen, Director of Storage Marketing Development, Supermicro
  • Ryan Meredith, Director of Data Center Workload Engineering, Micron

ストレージソリューションアーキテクチャー担当ディレクター

Ryan Meredith

ライアン・メレディスは、マイクロンのコアデータセンタービジネスユニットでデータセンターワークロードエンジニアリング担当ディレクターを務めています。オールフラッシュのSoftware Defined Storageテクノロジーのほか、AIやNVMe-oF/TCPなどの分野において、マイクロンのソートリーダーシップと認知度を高めるための新しいテクノロジーをテストしています。

Solutions Architect, Intel

Guest author, Kevin Gildea

Kevin Gildea is a Solutions Architect at Intel building engineering partnerships with global financial and trading firms. His recent research publications focus on optimizing HPC and low-latency workloads. Previously, Kevin was a Principal Architect at Hewlett Packard Enterprise (HPE), partnering with Cloud Service Providers on hyperscale datacenter deployments, high-performance computing, and AI infrastructure. Kevin holds a Bachelor of Science from MIT and is based in New York City.

Related blogs